Sunday, August 31, 2008

MONTHLY TECHNICALS FOR SEPTEMBER


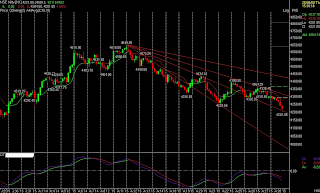
ABOVE 4400........................................BULLS TERRITORY.

BELOW 4300.......................................BEARS TERRITORY.

BETWEEN 4300-4400........................NEUTRAL

TRADE AS PER UR RISK APETITE. as markets could be pretty volatile this month.
Saturday, August 30, 2008

WEEKLY TECHNICALS 1ST SEPTEMBER

NIFTY FUTURE:
LAST WEEKS , HIGH :4395 LOW : 4208
CLOSE: 4370
S/R : 4324
NEXT WEEKS :
R1: 4441 R2 :4511
S1 :4251 S2 4137
NF may consolidate around 4320-24 levels next week..b4 taking a disntintive move..watch R1 & S1 closely next week , break of either will set the tone of direction & quickly take the nifty to the next levels..cheers.

Friday, August 29, 2008

MARKET REFLECTIONS

Markets took support as per the speed lines being shown last few days at 4200..opened and moved quickly above our magic no. 4304 , ( catching the short sellers/call writers by surprise) consolidated and moved on to take out 4335-45..closing at 4360..making a high of 4368 (which is higher than last swing of 4364) . this brings an end to august month,,where are we headed in september???????..lets MUSE over this during the weekend..enjoy the weekend , cheers.

DAILY TECHNICALS


Markets at supports..intraday charts show resistances at 4300-4413 and support at 4185 zone..as i said yesterday evening that care should be taken at 4200 levels ..DTI which cut downwards 2 days back still is below zero and pointing downwards..with global cues being positive markets should open in positive ..BREACH OF 4220 ( which is also 50% retracement of 3790-4650) may take the markets to 4160 zone which has to be held failing which as seen in the speed lines we will head to 3965 or lower levels..cheers & happy trading.

Thursday, August 28, 2008

MARKET REFLECTIONS

Back now, the markets made a top of 4304 ( our resistance watchout zone) and break of 4282 took it to straight to 4200 zone as written yesterday and b4..hope this helped all friends visiting my blog and were able to avoid this whip lash..the market was building up the FAKE OUT in the last few days and the classic trap started yesterday..,as we are near supports of 4190-4200 trade carefully..cheers

Wednesday, August 27, 2008

MARKET REFLECTIONS

Market could not cross 4380 and below 4345 slowly drifted to recheck yesterdays bottom..watch 4304 closely for any upmove, and break of 4282 may quickly take it below 4248 or sub 4200 zone..index shares lost in last hour of trade which is not a good sign..trade carefully in the coming days..do refer to daily technicals posted on 21st august for downwards targets in case of breakdown. cheers
AS i will be out so no daily technicals tomorrow. just look at global cues and see the levels above and trade ..

DAILY TECHNICALS

Nothing much has changed, markets recovered all losses of opening ..after hovering around 4304 for the whole day..cross of 4345 takes it to 4380 & 4430-50 range or break of 4304 will test 4248-4200..the markets may remain flat to positive, trade accordingly, cheers

Tuesday, August 26, 2008

MARKET REFLECTIONS

markets held on to 4304 zone thru out the day, traded around this zone.. and then forged ahead for the speed line target of 4345 , thereby leaving a higher low at 4283. despite weak global clues our markets held their ground and then gained in last hour. cheers

DAILY TECHNICALS

After the gap up yesterday on opening ,markets showed weakness and slowly drifted down. intraday charts showed weakness thru out the day and more selling was expected. with global cues also very weak, we can expect a drop to 4304 & retest of 4248 and more below 4335(speed line break of 4248 on charts yesterday showed that it can take us to 4200 & below ) . see how the market pans out and take ur call.. cheers.

Monday, August 25, 2008

MARKET REFLECTIONS

Markets gapped up as per global cues, but due to lack of follow up buying kept slipping thru out the day to end at the speed resistance of 4335..the way forward is still 4430 above 4335 and 4200 below 4250. It being the settlement week lets see how the drama unfolds. cheers.

DAILY TECHNICALS

US markets and now ASIA too is in positive territory due to falling crude.... the SPEED LINES are giving us the resistances of 4335-4430-4500 on intra day basis..notice also that DTI has cut into positive on friday so the move is up. ( DTI is a slow moving indictaor and when it cuts or turns it does give movement in the direction for sometime), it also gave the positive divergence signal like RSI on 22nd viz a viz 19th. break of 4248 can take markets to 4200 and & lower..cheers & happy trading..

Saturday, August 23, 2008

T A : R S I LESSON FOLLOW UP

classic example of what i had written abt. RSI divergence , it appeared yesterday..notice in the chart that when we were at 4316..RSI was way down below 10 and yesterday when we went below previous low..of 4316 to 4248..the RSI was around 20 and turning there by giving a signel from thursday that this selling will stop soon and it is giving POSITIVE DIVERGENCE. so cut your shorts today or next day and go long.. and the market just did that recovered all loss of the day and went on to close at high point of the day. one can also notice that RSI just touched the 50 mark( from low of 4316) and again turned down wards and the fall was very severe as below above 50 levels the trend sets in...cheers..

WEEKLY TECHNICALS 25 TH AUGUST.

NIFTY FUTURE: CLOSE- 4324

WEEKLY: HIGH-4458 LOW-4252

Stop/Reverse : 4345

R1 : 4437 R2 : 4551
S1 : 4231 S2: 4138

as markets are in oversold zone in intra day charts, an upward bias can be expected at the start og the week.the daily charts still has a downward bias so weekly s/r being 4345..trade according with strict stop losses. happy trading.

Friday, August 22, 2008

MARKET REFLECTION

nifty moved spot on in the range of 4248-4337...(ANDREW PITCHFORK WONDER) ,very close to my support and resistance level of 4250-4335.. it closed at the higher end of the intra range a good sign..stocks bought at opening gave good intra day profits whether index or mid/small caps..the bias defenitely was UP, good retracement from lower levels.lets ponder over the weekend and see where we are headed for the settlement week..enjoy ur weekend..cheers.

DAILY TECHNICALS

the soft cues turned into a blood bath after break of 4384 and broke all supports till it came near 50 sma.have posted the andrews pitchfork levels for intraday trading..nifty turns positive over 4335 and had 2 good supports down , one at around 4250 and final at 4200 & below...this is taken from the top ie 4650.DTI intra day is negative now. one can go long at these levels for a fast retracement of the oversold market. select stop pickings for delivery also can be done if we drift further down . cheers & happy trading

Thursday, August 21, 2008

MARKET REFLECTIONS

hope the levels provided today morning were enjoyed for shorting and making money ..pls. also refer to the chart of 17th august of nifty extensions..it had the first target of 4269.87...WE DID 4271.3..nice run from 4650...below this 4173-4050 are the targets in case weakness persists globally.hope friends visiting are enjoying the levels and making money in tension free trade. cheers..
ps. will post a ANDREWS PITCHFORK target for intraday levels and trading tomorrow..dont forget to visit..

DAILY TECHNICALS

markets took resistance around 4420-30 area the whole of yesterday and could not move ahead & and will remain resistance for today too as crude is climbing higher & asian markets are soft , a pull back can be expected. area to watch is 4384-4369-4316-4300. markets maybe in range bound move as global clues have not given any further moveup triggers so one can wait for some direction break out to initiatetrade.trade in small quantity only for a day or so & watch the volumes during the day and direction.. cheers and happy trading

Wednesday, August 20, 2008

DAILY TECHNICALS

the markets showed furious recovery from the bottom yesterday (making a hammer) on daily chart. the speed lines in the above intraday chart shows the range the nifty will move in the coming days..4420-30 is a resistance zone , cross of which takes the market goes to 4475-80 and then 4539 area strong support lies at yesterdays low or 4290 . the market was very oversold ( 5 straight days of selling) as shown by the RSI , its turned yesterday for upward journey ,which gets confirmed today with break of 20 level(do look at( RSI) TA below. bias looks upwards for the time being.. cheers & happy trading

Tuesday, August 19, 2008

T A : RELATIVE STRENGHT OF INDEX (R S I)

one of the great oscillators available for trading markets.some tips to use it:

(PLEASE REMBER THE BEST INDICATOR IS UR MIND,CONTROL THAT )

  1. I have found that using 20-80 parameter as oversold/overbought and 50 as the average range works well from INTRA TO MONTHLY CHARTS.
  2. please remember that cross of 20 or 80 does not mean that the market can be bought or shorted , but just that it moves now into the respective zones where care should be taken of the running trade.
  3. the reverse trade only taken when the rsi crosses 80 downwards/or rises from 20 upwards.
  4. crossover of rsi/average line closely monitered and wait for cross of 20/80 levels for trade.
  5. when RSI is losing strenght despite of the price going higher /lower it shows that negative/positive divergence has started and the present positions should be liquidated & contrarian direction can be initiated when other signels also confirm.
  6. cross of RSI over / below 50 line means that the trend is picking strenght , more positions shoould be added at this level as the direction has been set.
  7. it can remain overbought /oversold for long in a heavy trending market so very low/high rsi levels does not signel a contranian trade.
  8. its a slow indicator and best parameter is 14-1(60 mins or above), for intra day i use 5-3 for volatile markets in 10 mins time frame.

DAILY TECHNICALS

NIFTY remained trading around the 4400 zone throughout the day , with a negetive bias. the global cues today being negative the drift down to 4338 or 4300 which will lend the market some good support for a quick bounce back.60 min charts already are over sold and any GAP DOWN today should be utilised for opening long positions for a bounce back. look at weekly techs. and trade ..happy trading & cheers

Sunday, August 17, 2008

DAILY TECHNICALS for 18th

nifty extension targets here are 4270 - 4173 - 4050. the AMA(ADAPTIVE MOVING AVERAGE)may lend nifty support in the zone of 4400 from where a bounce back to 4539-4630 will still be the swing targets of the rally back. the DTI (DIRECTIONAL TREND INDEX)as you will see still has a positive bias, DTI had signelled a trend reversal at the bottom and now when the AMA(turns red) & DTI cross over downwards , all longs should be exited from as reversal of the upmove of last 5 weeks will start ...buy in dips till the trend is up ,,,cheers and happy trading.


Friday, August 15, 2008

MONTHLY GOLD CHARTS


gold chart for planning a buy. IT IS VERY NEAR THE STRONG SWING SUPPORT 10,800/-..as it was a major swing top of past, hope it stabilises here. ..any break here and a few closes below this will take gold sub 10 K levels..cheers and happy buying

WEEKLY TECHNICALS 18TH AUGUST

HAPPY INDEPENDENCE DAY TO ALL FRIENDS.

NF RANGE WEEK : HI- 4654 LO- 4425

WEEKLY CLOSE4437

S/R NEXT WEEK :4505

R1- 4585 R2-4793

S1- 4357 S2 4277

though the daily technicals have a downward break out, some more steam is left in the weekly technicals. buy on dips for a quick profit is advocated for this week.
HAPPY TRADING

Thursday, August 14, 2008

DAILY TECHNICALS

the speed line drawn suggest that a temporary top at 4630 is in place which also is becoming a big resistance.the range of the support lines are 4438-4278-4100. trading stratergy, can be buy in dips at any good support or sell on rise with 4630 NS close as stop loss. the weekly techs, extension can be kept . the DIRECTION TREND INDEX (DTI) is still showing a positive bias upwards so this could be a correction of the ongoing UP move. happy trading cheers

Wednesday, August 13, 2008

T A : FAKE OUT

yesterday and today are very classy examples of typical fake out by markets.. smart market participants who generally are big money like INSTITUTIONS/HNIs , etc normally tend to take markets higher than their tops or lower than their bottoms and then comes the sudden reversal which takes the markets quite far from where it was supposedly going thus causing pain and loss to smaller /retail participants.this normally will happen at the end of a trend which will confuse all those who never participated in the major move and now are keen to get in..do study this move of yesterday/today.. u will find so many similarities. from the past... LESSON IS: DONT ENTER AT THE END OF THE MOVE. cheers

DAILY TECHNICALS

we did not cross the NF 4659-64 , the level of resistance we said..and a sharp correction came..as the US /ASIAN markets are weak we can head now below 4525 towards the swing target 4464 , break of which can take us quickly 4368-4300 range..(NF has support at 4350-4210 range this month). the strong swing resistance of NS 4679 needs to be crossed deceisively to continue the UP momentum. cheers and happy trading.

Tuesday, August 12, 2008

DAILY TECHNICALS

nifty future should see a good resistance today in the range of 4659-64.difficult to cross this .. this should signal a slow down of the UP momentum(oil below $114 also helped this upmove again ) .nifty spot is heading towards the swing target of 4679.lets see whether we reach there.happy trading

Monday, August 11, 2008

NIFTY EXTENSION TARGETS


seems we are now inching towards a top ..nifty after a gap up(squeezed the shorts again) moved the whole day in a range which is around our area of 4605..till it broke out in late trade...will not recommend any fresh buying at this level rather better to keep posting profits and shifting to cash..or buy in dips only..break over 4725-50 will gallop the markets up...weekly N F targets/supports still remain same ,though this is a truncated week of trading. cheers

Sunday, August 10, 2008

NIFTY FUTURE WEEKLY TECHNICALS.11th to 14 th.

nifty after a nice long ride from 3790 seems to be peeking off somewhere soon..so lets see what we can expect in the coming week.

CLOSE: 4547.

STRICT STOP & REVERSE : 4513

RESISTANCE :4664-4780

SUPPORT :4396-4245.

THE RANGE CAN BE 4690 TO 4280

best of trading

welcome all friends.

i would like to extend a warm welcome to all friends to this blog spot which i am starting. i will try to make this journey through market technicals fruitful and interesting for all vistitors of this blog by the knowledge of technicals that i picked up over the last few years. thanks and welcome again..

rajan bhatia
new delhi